Karyogram viewer
The karyogram is an interactive ideogram of all chromosomes, with an individual’s markers plotted at their genomic positions. Each point is colour- and shape-coded by result, hover shows a tooltip, and you can pin an info card or embed the whole chart beside the person on the pedigree.
Where to find it
There are two ways in, both tied to a selected individual:
- In the Genetics panel (dock button, or press
g), open the individual section and click the Karyogram row. - In the Individual panel’s Markers heading, click the Karyogram button — it opens the Genetics panel straight to the karyogram.
The Genetics panel floats over the canvas and can be dragged, and resized from any edge or corner; its dock icon highlights while it is open.
What the view shows
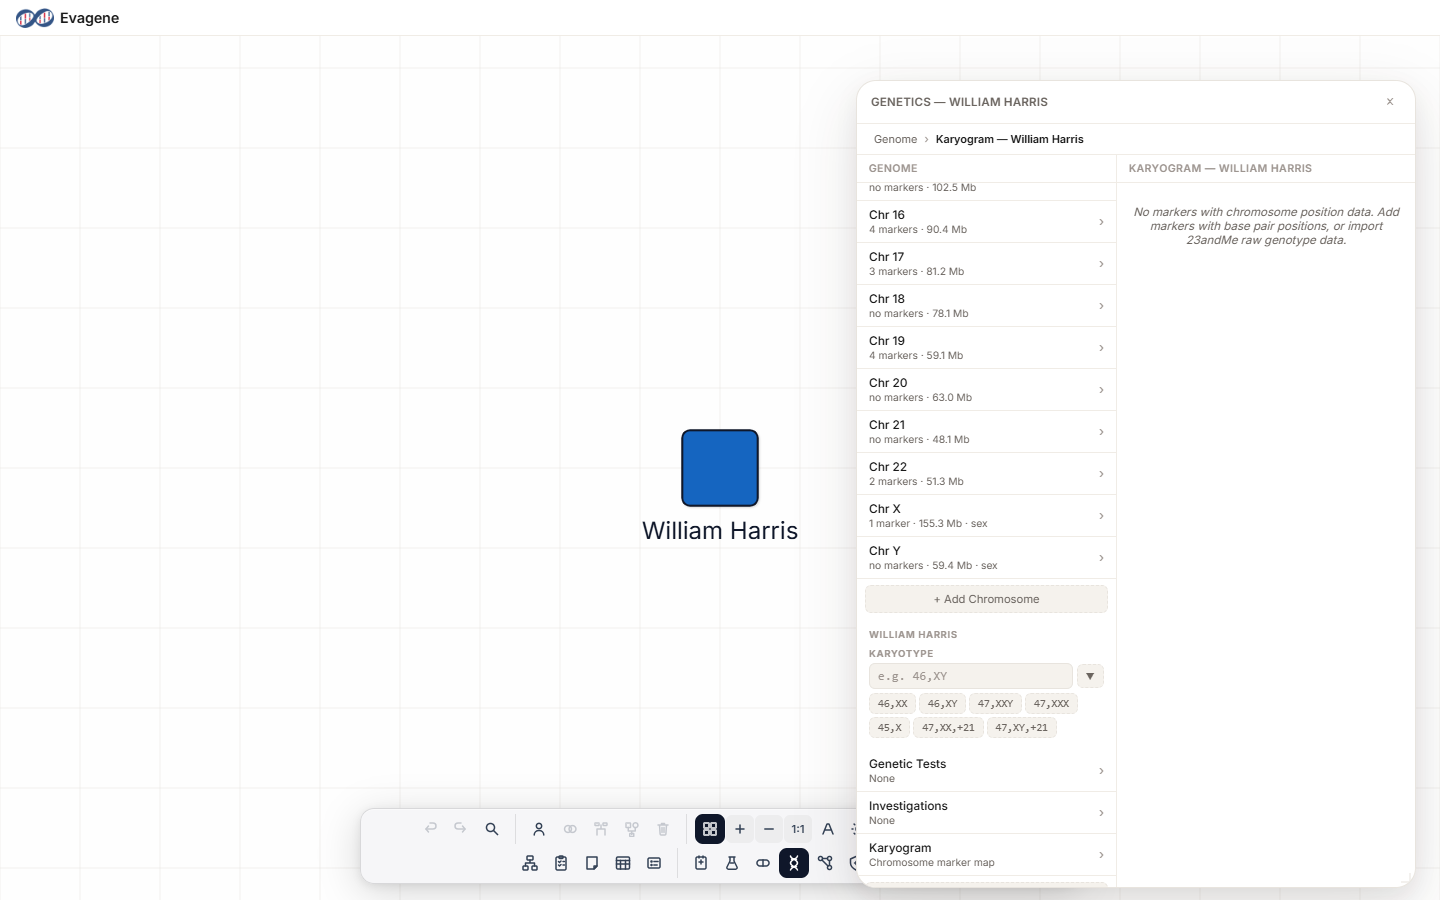
The view is titled Karyogram — {name}. It shows the karyotype at the top if one is set, then draws all chromosomes (1–22, X, Y; GRCh37/hg19) with markers plotted at their positions. Markers are sourced from imported genetic tests that carry a chromosome and position, and from individual markers that have a base-pair position. If none qualify, the view reads:
No markers with chromosome position data. Add markers with base pair positions, or import 23andMe raw genotype data.
Reading the plot
Each marker is colour- and shape-coded by result:
| Result | Symbol |
|---|---|
| Positive | Red triangle |
| Negative | Green square |
| VUS | Orange circle |
| Not tested / no call | Grey dot |
Hovering a marker shows a tooltip with Gene, Variant, rsID, Genotype, Result, Individual, and Chr n:position. Clicking a marker pins an info card; click empty space to dismiss it. The Show karyogram on canvas checkbox in the Individual panel’s Markers heading pins the karyogram as an anchored chart beside the individual on the pedigree.
Worked example · Plot and inspect a marker
We will plot a marker for a fictional person and read it off the ideogram.
- 1Give the marker a position. Make sure a marker on the individual has a Position (bp) set (see Markers) — only positioned markers are plotted.
- 2Open the karyogram. In the Individual panel’s Markers heading, click the Karyogram button.
- 3Hover to read it. Move the pointer over the plotted point to read its tooltip (Gene, Variant, rsID, Genotype, Result, Individual, Chr n:position).
- 4Pin it. Click the point to pin the info card; click empty space to dismiss it.
- 5Embed it. Tick Show karyogram on canvas to anchor the chart next to the person on the pedigree.
Good to know. Only markers with a base-pair position appear on the plot. If the karyogram says “No markers with chromosome position data”, add a Position (bp) to an existing marker, or import 23andMe raw genotype data, and the points will appear.
About Evagene. Evagene is an academic, research, and educational pedigree modelling platform. It is not a medical device and is not intended to diagnose, prevent, monitor, predict, treat, or manage disease, or to determine eligibility for screening, testing, referral, or treatment, or to replace professional clinical judgement. Outputs are illustrative and for educational / research purposes only.